|
This was the week when on this side of Suez we truly started to feel the impact. ICE gasoil at $200/bbl, refineries fighting over cargoes, flows rotating east, and prices at the pump moving higher… but what about futures? why haven’t those exploded higher?
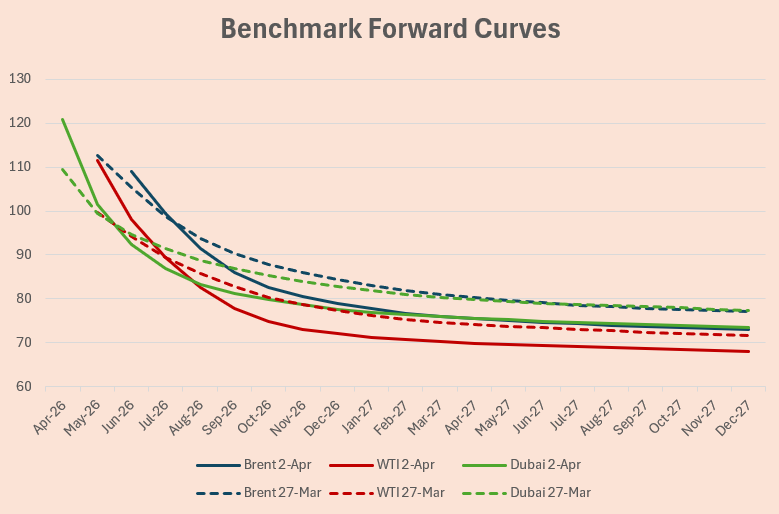 |
After Trump’s speech, we saw some tightening in futures, not in outright price, but in the shape of the curve, with prompt spreads at all-time highs, trying to reflect what we’re seeing in the physical market where physical premiums are blowing up (Brent and WTI—Dubai is dead). However, in absolute terms, front-month futures still look hesitant, near the highs of recent weeks but nowhere close to reflecting what’s actually happening on the ground.
 |
So this week, my head revolved around one question: who is selling futures?
Beyond the usual manipulation concerns, the reality is that this market is too large to intervene directly… but what about indirectly?
First, let’s identify the players in the futures market.
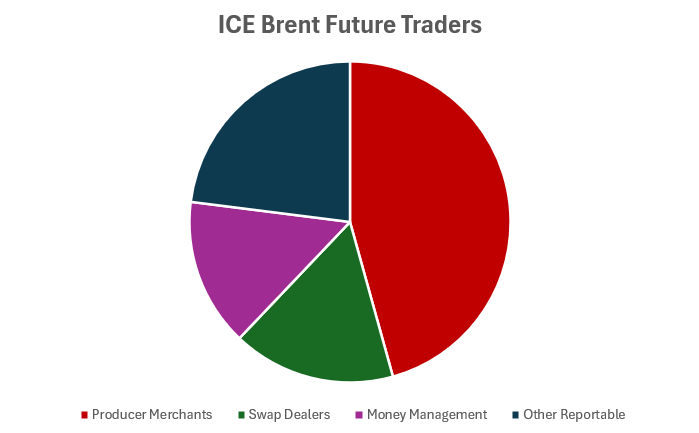 |
Contrary to what many think, speculative flows are not the dominant force here. The physical market is—if you combine swap dealers and producers (or trading houses), who use futures as a natural hedge. Then you have other reportables… a bit of a black box, but my suspicion is that this bucket includes structured products—particularly those ETFs tracking oil—and that part of the distortion we’re seeing in futures, especially in the Brent/WTI spread, may be coming from there.
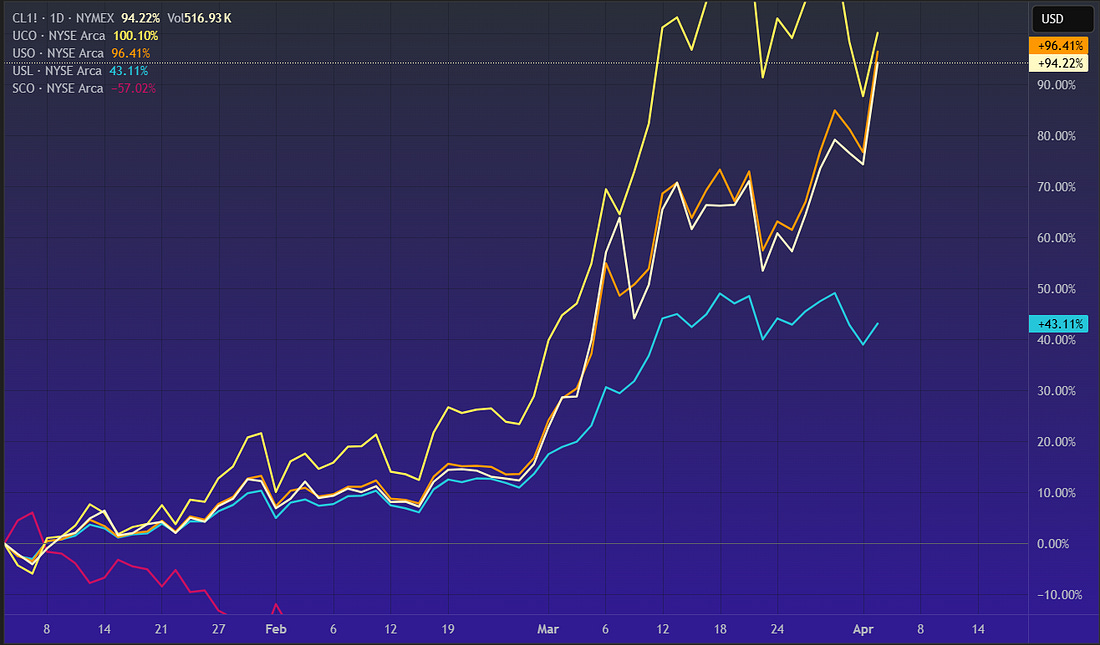 |
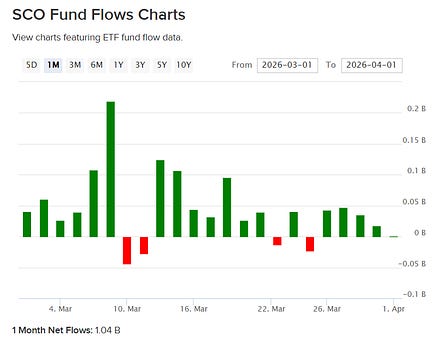
I picked the four most popular ETFs: USO, ULS, UCO, and SCO… together they don’t even reach $5bn in AUM, so the answer is probably no, but there are still some interesting takeaways.
 |
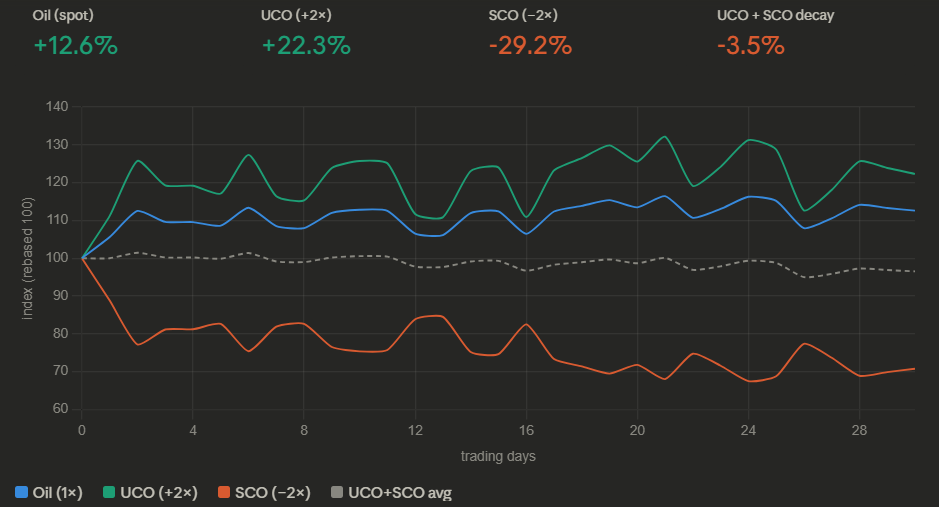
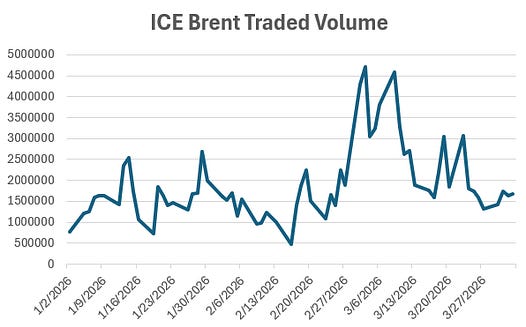
UCO and SCO in particular—leveraged ETFs delivering 2x daily returns (UCO) and -2x inverse exposure (SCO)—saw trading volumes explode during March. But what are they actually tracking? These instruments, popular among the more aggressive crowd, replicate the Bloomberg Commodity Balanced WTI Crude Oil Index (BCBCLI), composed of roughly 33% front-month, 33% Dec26, and 33% Jun27 exposure via WTI futures or dedicated swaps—which means they’re not really trading the May contract.
 |
Next is the most well-known: USO, the largest with around $2bn in AUM, with a much simpler structure—100% long front-month futures. ULS is also long WTI but distributes exposure evenly across the next 12 months.
One thing to point out though, is that these ETFs not necessarily are positioned 100% on future contracts, at least not directly, since they can achieve the investment purpose (ie.. replicating the daily variation of oil) with “total return swaps” they get from banks. Now, I would like to believe that those bank turn around buy/sell futures to offset the swap positions, but might not be always the case.
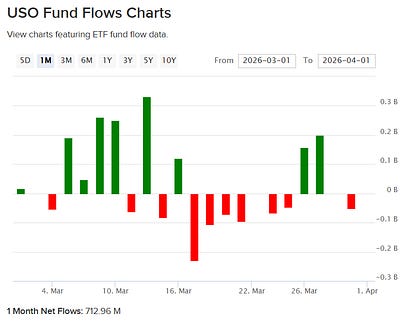 |
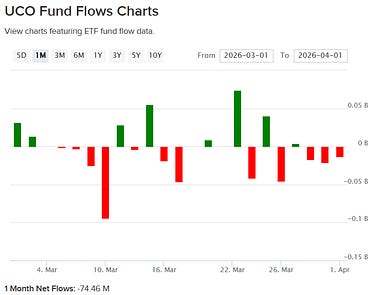
You can clearly see how each structure performed given how the curve moved recently. But what stood out to me was the net flow into these ETFs—particularly SCO, which has to sell contracts every time new shares are created. The fact that such a highly speculative instrument—one that’s not even meant to be held overnight—trades more volume than the most popular ETF is, at the very least, interesting.
It’s likely that equity funds are using SCO as a hedge against portfolios with energy exposure, which rallied more than 30% during March. The problem, as with all leveraged ETFs, is volatility decay/beta slippage, which drives these products toward zero over time—meaning they’re typically held for no more than a few days, maybe a week.
This could partly explain why the back end of the curve looks depressed—but not why the front month remains capped.
One important factor to consider is the roll. WTI futures typically expire around the 20th of each month (Brent on the last day), as they are physically deliverable contracts and require about 10 days to coordinate logistics before the delivery month begins. Ahead of expiry, these funds start rolling positions into the next month—for example, selling May and buying Jun if they’re long, or the opposite if they’re short. To avoid being front-run, they spread this activity over 3 to 5 days.
During the roll, the structure of the curve, known as “roll yield”—becomes critical. If you sell 1,000 May contracts at $111 and buy 1,000 Jun at $98, that’s a $13 gain that flows directly into the fund’s NAV… an extreme case, but if we somehow reach mid-April with spreads like this, you know what to buy.
 |
Another way to play these instruments is through volatility. If this dislocation lasts another 2–3 weeks, shorting these ETFs could be a way to extract some carry.
Going back to the original question, are ETFs responsible for the weakness in futures pricing? I don’t think so. But they’re definitely not helping push prices higher either.
The producer merchant flow, is a constant one, and with less physical barrels to hedge, I doubt where we could see selling pressure.. if any refineries should be bidding up in case they actually manage to get a cargo. One explanation I can find around that is that they are hedging oil exposure with gasoil futures.. because of GO limited upside on demand destruction??
 |
Maybe the real question isn’t who’s selling futures… but whether there’s anyone left buying? It appears that “Long Oil” is not a crowded trade…...
Keep reading with a 7-day free trial
Subscribe to Oil not dead to keep reading this post and get 7 days of free access to the full post archives.
A subscription gets you:
| Oil Weekly Commentary | |
| A custom App and chat | |
| We might start doing webinars |
![]()
![]()